Sage Carter · 19 October 2026
Community Smartphone Mapping Tracks Informal Settlement Expansion Along Cape Town's Urban Periphery
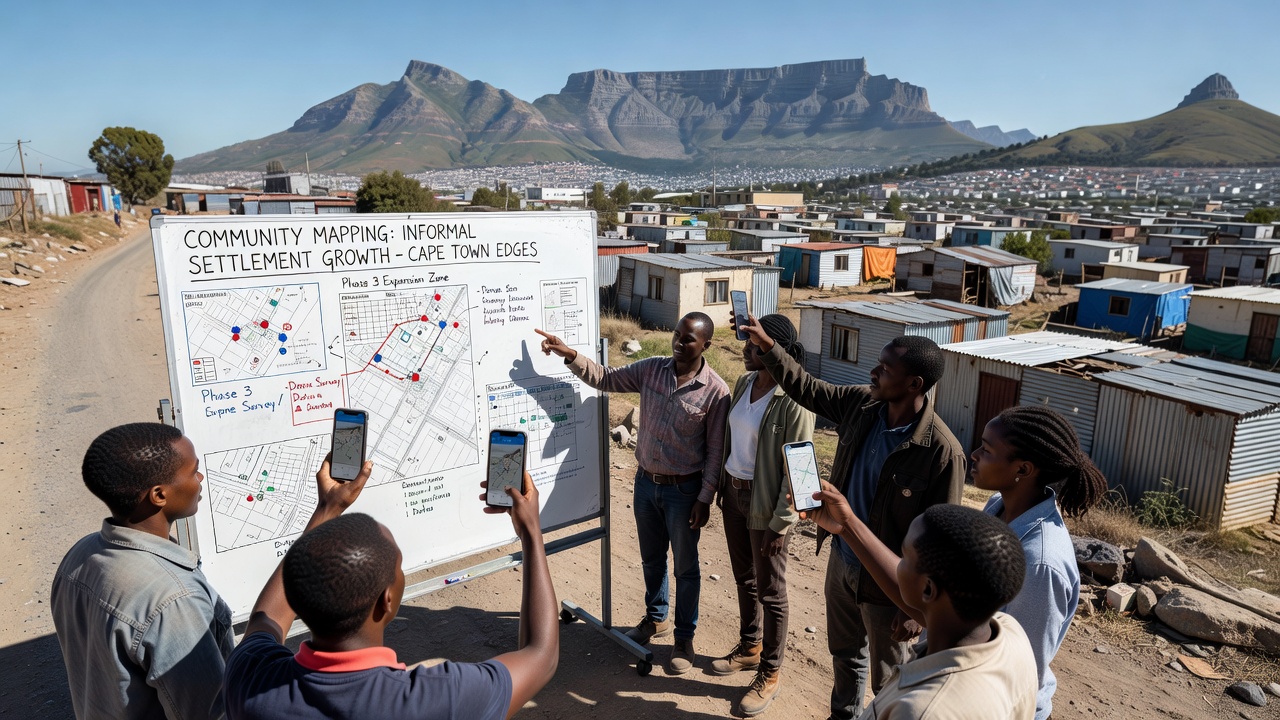
Community-led smartphone mapping projects have documented informal settlement growth across Cape Town's expanding urban edges for several years, and these initiatives rely on residents equipped with GPS-enabled mobile devices to record spatial data in real time. Local groups coordinate with technical partners to collect coordinates of new structures, pathways, and service points while they update existing maps through repeated field surveys that occur on weekly or monthly cycles. Data collected through these efforts feed into open geographic databases that show how settlements extend outward from established neighborhoods toward the city's northern and eastern boundaries.
Core Methods Behind Resident-Driven Data Collection
Participants download custom mobile applications that integrate satellite imagery overlays with offline GPS functionality, which allows mapping to continue in areas where network coverage remains unreliable. Teams walk predefined routes and tag individual dwellings along with water points, sanitation facilities, and informal roads, while they cross-reference each entry against previous survey rounds to identify changes in settlement density. Software platforms then process these inputs into layered visualizations that highlight incremental expansion patterns over successive months and years.
Training sessions run by experienced volunteers cover basic device calibration, data privacy protocols, and standardized tagging conventions so that contributions from different neighborhoods remain consistent across the broader dataset. Regular review meetings allow groups to resolve discrepancies between multiple surveyors who cover the same zones, and this iterative process improves positional accuracy to within a few meters of actual locations according to independent validation checks conducted by partnering universities.
Documented Growth Patterns Through 2026
Records compiled through these projects indicate steady outward movement of informal structures along transport corridors and near industrial zones between 2023 and 2026. Areas such as the northeastern periphery near the N2 highway and sections adjacent to the R300 beltway show clusters of new dwellings appearing at rates that exceed earlier baseline measurements from 2020. October 2026 updates reveal continued infilling within previously mapped boundaries alongside fresh extensions into adjacent agricultural or vacant land parcels.
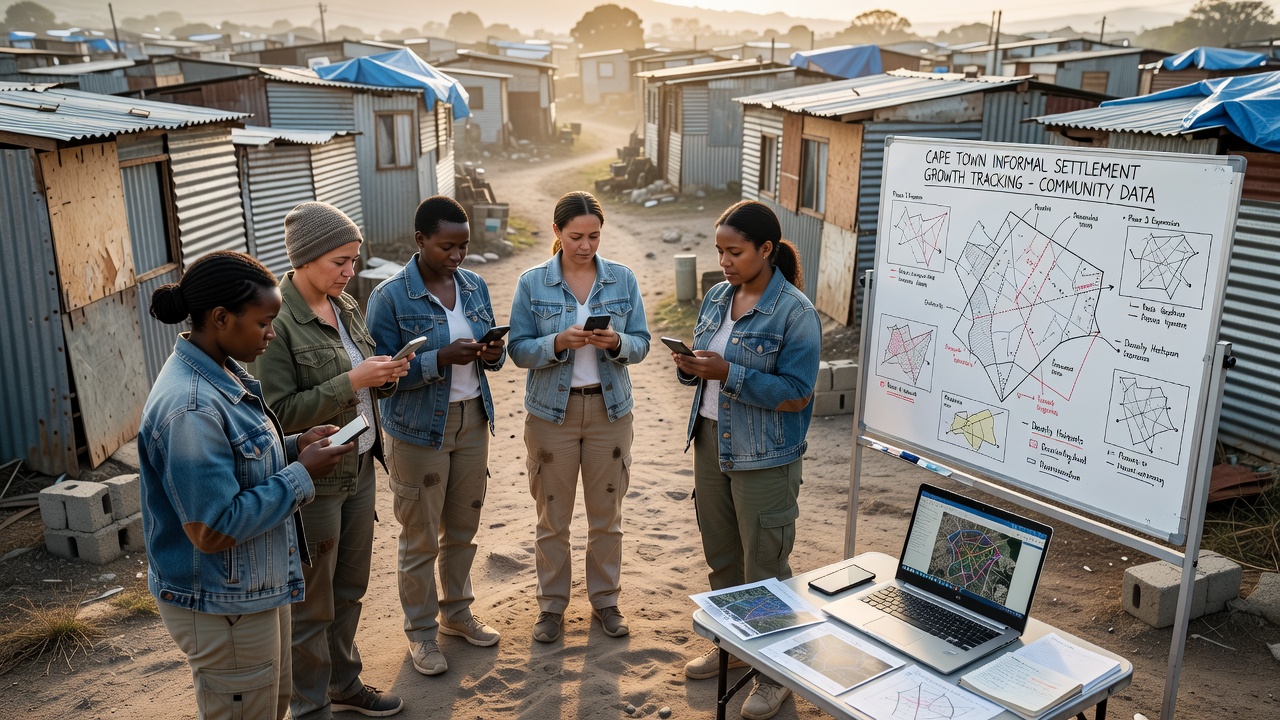
Analysts compare sequential map versions to calculate changes in built-up area and to identify linear development along drainage lines or power infrastructure routes. These spatial trends align with broader observations from national housing audits that note similar dynamics in other major South African cities, although Cape Town-specific datasets offer higher temporal resolution because of the frequency of resident surveys.
Partnerships and Data Integration
Local mapping collectives share anonymized datasets with municipal planning departments and research institutions that incorporate the information into larger urban growth models. United Nations Human Settlements Programme reports reference similar citizen-generated geographic information from African cities as a complementary source alongside official census figures. City officials have used these community layers to prioritize infrastructure upgrades and to adjust evacuation planning for flood-prone zones identified through repeated mapping cycles.
Technical support comes from open-source mapping communities and regional universities that provide server hosting along with periodic workshops on data quality assurance. One project in the Delft area expanded its coverage after residents received donated smartphones preloaded with mapping tools, which increased the number of active contributors and allowed surveys to reach previously undocumented pockets near the airport precinct.
Accuracy Considerations and Validation Steps
Independent checks by professional surveyors confirm that smartphone-derived coordinates achieve sufficient precision for planning purposes when teams follow consistent collection protocols. Discrepancies arise mainly from seasonal vegetation cover that obstructs satellite signals or from rapid construction that outpaces update schedules. Groups address these issues through follow-up visits and by cross-checking against drone imagery supplied by academic partners on a quarterly basis.
Public dashboards display both raw contribution logs and processed maps so that residents can verify entries and suggest corrections. This transparency loop encourages ongoing participation while it maintains accountability for the geographic information produced.
Conclusion
Smartphone-based mapping by Cape Town communities continues to generate detailed records of informal settlement dynamics along the city's outer edges as of October 2026. These datasets integrate resident observations with technical validation methods and support coordination between local groups and government agencies. Ongoing refinements in collection tools and partnership structures sustain the flow of spatial information that tracks how urban growth unfolds in real time.